Granular Matter - Granular Matter's Gallery of Covers
Each issue, Granular Matter features a visually striking figure or image on its cover. To further highlight this, we will be collecting them here.
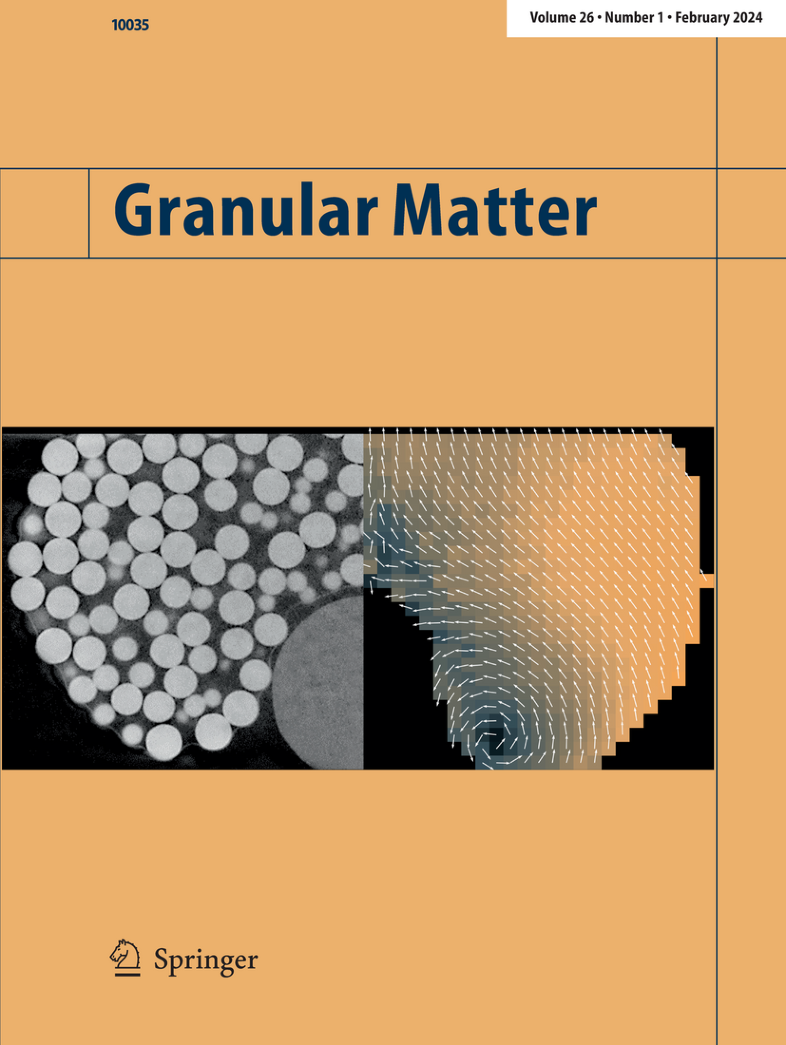
February 2024
 (this opens in a new tab)
Figure taken from:
Effect of Particle Size on the Suction Mechanism in Granular Grippers (this opens in a new tab)
By Angel Santarossa, Olfa D’Angelo, Achim Sack & Thorsten Pöschel
Granular gripper in action, holding a spherical object. Left: The granular medium is seen jammed in the X-ray tomogram slice, achieved by evacuating air from the gripper. Right: Particles displacement field, calculated from tomograms taken before and during jamming.
November 2023
 (this opens in a new tab)
Figure Taken From:
A model packing based on a tree of face-to-face regular tetrahedra for monodisperse spheres (this opens in a new tab)
By Alain de Ryck
Visualization of a volume of size 24X24X7 for a stacking model of spheres of diameter 1. The model implements the spheres by placing them on 3 others into mutual contacts. Their centres form a regular tetrahedron face-to-face to a preceding tetrahedron. Lower part: filling of sphere when it is no longer possible to add new ones; upper part: the tree of face-to-face tetrahedra; middle part: skeleton of the links between the centres of 2 face-to-face tetrahedra. Colours: from red to blue, connectivity of the spheres (from 12 to 1), tetrahedra (from 4 to 1) and links (from 6 to 1).
August 2023
Figure taken from:
Structural transitions in jammed asymmetric bidisperse granular packings (this opens in a new tab)
By Juan C. Petit & Matthias Sperl
May 2023
 (this opens in a new tab)
Figure taken from:
Modelling of the coefficients of restitution for prolate spheroid particles and its application in simulations of 2D granular flow (this opens in a new tab)
By Yrjö J. Huang, Ming Hu & Tianyi Zhou
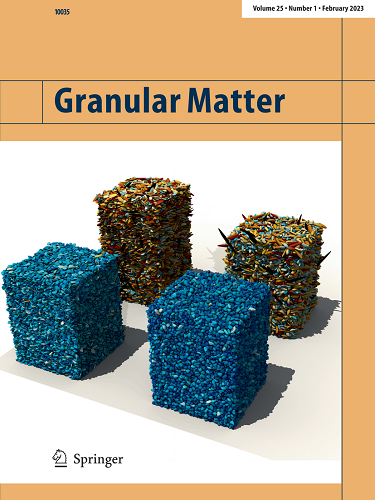
February 2023
 (this opens in a new tab)
Figure taken from:
Effect of sediment form and form distribution on porosity: a simulation study based on the discrete element method (this opens in a new tab)
By Christoph Rettinger, Ulrich Rüde, Stefan Vollmer & Roy M. Frings
November 2022
 (this opens in a new tab)
Figure Taken From:
Triaxial compression behavior of 3D printed and natural sands (this opens in a new tab)
By Sheikh Sharif Ahmed & Alejandro Martinez
August 2022
 (this opens in a new tab)
A series of novel algorithms were developed to generate the 3D random particle models with controllable shape and size configurations to simulate coral sands with random shape characteristics (top panel). Using a 3D unstructured meshing algorithm, a finite element model of particulate systems was obtained (middle).
Additionally, a new compaction algorithm combining the gravity action and mechanical motion of particle models was proposed to create the 3D sand particulate system with various particle gradations (bottom).
Figure Taken From:
Three-dimensional mesoscale modelling of the compressive behaviors of coral sand (this opens in a new tab)
By Jinhua Zhang, Zhangyu Wu, Qin Fang, Li Chen & Kai Ding
May 2022
 (this opens in a new tab)
Impact of a projectile against a granular layer in free fall. The experiment allows to simultaneously observe the upper (corolla) and lower (crater cavity) deformation of a granular layer under microgravity conditions. This setup opens a new way to study the possible effects of collisions between dust grains under microgravity conditions, a fundamental process in the early formation of planets in protoplanetary disks.
Figure Taken From:
Geometrical description of impact cratering under microgravity conditions (this opens in a new tab)
By Cristian Villalobos, Mauricio Housset & Germán Varas
February 2022
 (this opens in a new tab)
Entrainment of substrate material (red) at the base of a granular flow (blue) created by using a top plate (beige) and periodic boundary conditions in 2D. We imposed a velocity and solid pressure on a bed to mimic the arrival of the basal portion of a thick granular avalanche on an erodible bed. The granular flow lowers the friction coefficient of the substrate through diffusion of granular temperature downward (non-local granular fluidity), which enhances the erosion process. The figure depicts the bed 15 seconds after arrival of the flow, and subsequent bulking process.
Figure Taken From:
Investigating the rheology of fluidized and non-fluidized gas-particle beds: implications for the dynamics of geophysical flows and substrate entrainment (this opens in a new tab)
By Breard C. P. Eric, Fullard Luke, Dufek Josef, Tennenbaum Michael, Fernandez-Nieves Alberto & Dietiker Jean-François
November 2021
 (this opens in a new tab)
Diamond-shaped asteroids. Left: The asteroid Bennu imaged by OSIRIS-REx mission (Courtesy: NASA). Top right: Surface profile of a rapidly rotating asteroid obtained in granular simulations. Bottom right: Results from granular simulations of a rapidly rotating asteroid.
Figure taken from:
Bennu and Ryugu: diamonds in the sky (this opens in a new tab)
By: Tapan Sabuwala, Pinaki Chakraborty & Troy Shinbrot
August 2021
 (this opens in a new tab)
The image represents the synergistic relationship between the structure and thermo-hydro-mechanical properties of granular materials subjected to thermal cycles. Thermally induced microstructural changes alter the stiffness, thermal conductivity, and permeability of granular materials. The temperature field is symbolized by the color gradient of the particles. The microstructure is highlighted by the gray inter-particle contacts supporting the stress and the flow of heat. The pore network supporting fluid permeation is represented by the blue tessellation.
Figure taken from:
Thermal cycling effects on the structure and physical properties of granular materials (this opens in a new tab)
By: Jibril B. Coulibaly, Manan Shah & Alessandro F. Rotta Loria
May 2021
Granular temperature is a measure of the vibration or jiggling of grains. The particles on the left, which are at rest and are not vibrating, have a low granular temperature, as indicated by the blue thermometer. The particles on the right, however, are vibrating strongly and a suitable granular thermometer would measure a high granular temperature in this case. In the article “A Granular Thermometer” an experimental technique is presented which uses X-ray radiography based tracer particle tracking to unobtrusively infer the granular temperature field in space within a granular medium.
Figure taken from:
A granular thermometer (this opens in a new tab)
By Zvonimir Maranic, François Guillard, James Baker, Itai Einav & Benjy Marks
February 2021
This study explores the impact of the grain size distribution (GSD) on the jamming packing density and connectivity of samples composed by spherical particles. The figure shows a mesoscale view of a sample with size ratio equal to 32, which is quite atypical in DEM simulations. Some of the analyzed systems contained about 500000 particles, generating more than one million contacts once in equilibrium. The color scale encodes the particles' size. Results from this study show that both the size span and the shape of the GSD play a major role in both packing density and connectivity, while shedding light on the practically unexplored realm of highly polydisperse systems
Figure taken from:
Densest arrangement of frictionless polydisperse sphere packings with a power-law grain size distribution (this opens in a new tab)
By William Fernando Oquendo-Patiño & Nicolas Estrada
November 2020
Instantaneous raw snapshot of laboratory-scale pulsed fluidized bed filled with glass beads depicting bubble formation created by sinusoidal 4Hz input with Lagrangian paths of individual particle tracks overlaid. Each of the paths of the individual particles are determined from the 200 following images using `flowonthego' optical flow velocimetry. All raw images used in the analysis are collected using a fast-tec high-speed camera at 200 Hz. The bed is lit using high intensity LED lighting from rear to highlight bubble formation and from front to highlight individual particle boundaries for tracking purposes. The image depicts the realtime ``granular temperature" at the formation of a second bubble, mirroring the path of the exiting bubble.
Figure taken from:
Using a proper orthogonal decomposition to elucidate features in granular flows (this opens in a new tab)
By J. E. Higham, M. Shahnam & A. Vaidheeswaran
August 2020
The influence of the particle size on the vertical plate penetration into dense cohesionless granular materials was numerically investigated using DEM. Simulations were performed in quasi-two-dimensional conditions by changing the median particle diameters d50 but maintaining the plate thickness B. The initial bulk packing fraction was kept high, irrespective of the particle size. Upper and lower figures show the result of small (B/d50 = 63) and large particle size case (B/d50 = 21), respectively. In the small particle size case (B/d50 = 63), the size ratio reached almost the same level as that in the laboratory and the dynamics of 35.5 million particles was considered. Right and left figures illustrate instantaneous shear strain rate and local packing fraction distributions, respectively. Large qualitative change in the granular behaviors as well as penetration resistance was observed between B/d50 = 31 and 21. The intermittent nucleation and disappearance of the shear bands were clearly observed only for large B/d50 cases.
Figure taken from:
Influence of particle size on vertical plate penetration into dense cohesionless granular materials (large-scale DEM simulation using real particle size) (this opens in a new tab)
By Shinichiro Miyai, Murino Kobayakawa, Takuya Tsuji & Toshitsugu Tanaka
May 2020
Configurations of ternary samples of similar ellipsoids of various fractions of small particles and the triangular contour graph of the void ratios of ternary samples
Figure taken from:
Packing void ratios of very dense ternary mixtures of similar ellipsoids (this opens in a new tab)
By Tang-Tat Ng & Louis Ge

